

"By applying the analytical skills I learned on the programme, I have automated multiple reliability reports using PySpark and SQL, replacing manual processes and decreasing data processing time by about 80% in some cases." - Dorota Kowalska, Reliability Engineer, Easyjet.
Data processing can be a lengthy process. But there are tools you and your team can use to help make it more efficient. Continue reading as we dive into the 4 key tools that will help your data team save time spent processing your organisation’s data.
What is data processing?
Data processing is the act of collecting and transforming raw data into useful information, which is a fundamental step in data analysis and crucial for making informed decisions.
The key steps involved in data processing are:
- Data collection: This is the first step and involves gathering raw data from various sources like surveys, databases, or sensors.
- Data cleaning: This step ensures data quality and involves removing or correcting errors, duplicates, and inconsistencies within the data.
- Data transformation: This step entails modifying data into a suitable format. This could involve normalising, aggregating, or encoding data.
- Data analysis: This is the part of the process where the analysing takes place, to uncover patterns, trends and valuable insights. These insights give organisations a much clearer understanding of what’s happening behind the scenes.
- Data visualisation: Visualisation is the process of presenting the analysis results visually, using charts, graphs, or dashboards for easy interpretation.
Throughout these steps, effective and user-friendly tools are available to assist in every stage of your data processing journey.
Data processing tools
Let's explore the “Big 4” tools that can aid your team in data processing tasks.
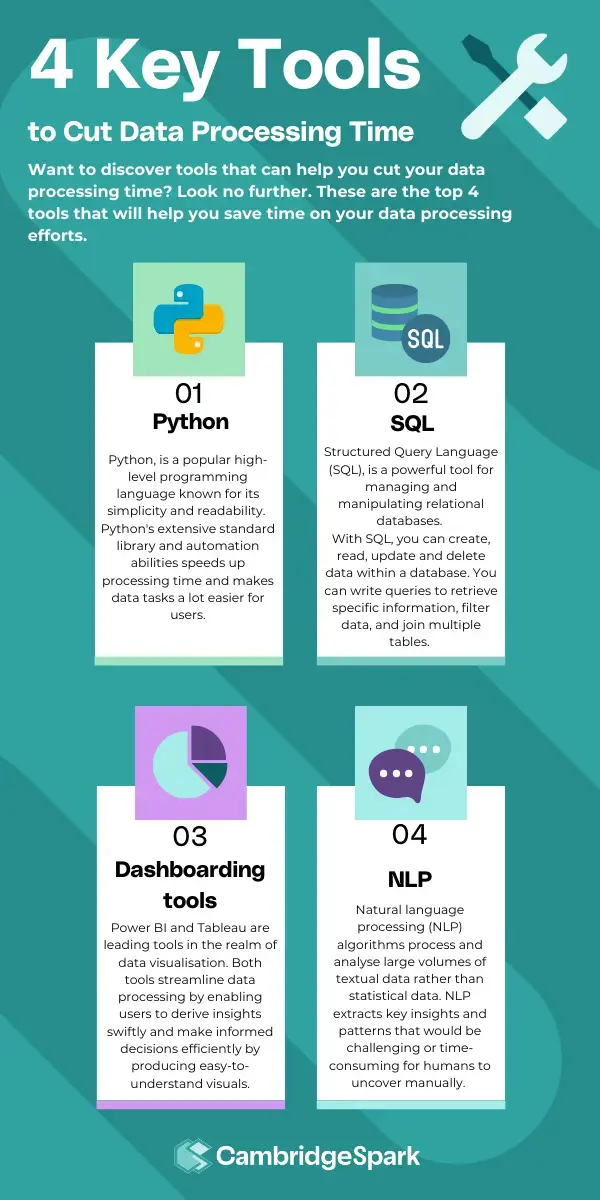
1. Python
Python, released in 1991, is a popular high-level programming language known for its simplicity and readability. Over the years, it has evolved into a versatile and powerful language. Developers often favour Python over other languages for its relatively simple syntax, which makes coding more intuitive, and for its cross-platform compatibility.

Python programming supports every step of the data processing journey, from data cleaning to analysis and visualisation. It is widely used in data analysis, artificial intelligence, scientific computing, and web development.
Python's extensive library provides tools and modules for numerous tasks, reducing the need for additional code. This feature speeds up development time and simplifies data tasks for users.
For example, Pandas, a Python library, simplifies data analysis with its DataFrame and Series objects, making data manipulation and analysis straightforward.
Other libraries like Seaborn and Matplotlib enhance data visualisation capabilities. They facilitate the creation of static, animated, and interactive visualisations. Matplotlib, for instance, supports various plot types such as line graphs, bar charts, scatter plots, and histograms.
One key advantage of Python is its automation capability. Its easy-to-read syntax allows for quick scripting, enabling efficient automation of repetitive tasks. This capability saves organisations significant time and enables employees to focus on more in-depth and high value activities.
Jonathan Wagstaff, Director of Market Intelligence at DCC, said this about Python:
 “The stuff that really caught the attention of the management team was a lot of the automation work the team was doing—using Python scripts to automate very complex, large data processing jobs. Automating manual processes and creating ML-powered recommendation engines was where we were freeing up a lot of time for the teams and very quickly making an impact and ROI.”
Python also has a large community, ensuring plenty of resources, libraries, and frameworks for developers. This support network enhances learning and problem-solving, encouraging widespread adoption and continuous community-driven improvement.
2. Structured Query Language (SQL)
SQL, or Structured Query Language, is a standard language for database creation and manipulation. It is a powerful tool for managing relational databases and allows users to interact with databases efficiently and effectively.
With SQL, your team can create, read, update, and delete data within a database. They can write queries to retrieve specific information, filter data, and join multiple tables. This ability to handle data retrieval and manipulation makes SQL essential for database management.
SQL also allows users to define the structure of a database. They can create tables, define relationships, and set constraints to ensure data integrity.
Some of the main benefits of SQL include:
- Ease of use: SQL has a simple, readable syntax, making it easy to learn and use, even for beginners.
- High performance: SQL is designed to handle large datasets efficiently, performing complex queries and operations quickly.
- Standardisation: SQL is a standardised language, widely supported by various relational database management systems, including MySQL, PostgreSQL, Oracle, and Microsoft SQL Server.
- Flexibility: SQL can handle a wide range of data types and supports various operations, making it versatile for different applications.
Dorota Kowalska is a Reliability Engineer at Easyjet. One of the key parts of Dorota’s role is collecting, cleansing, analysing and interpreting reliability data. After upskilling in data analysis, Dorota managed to achieve a saving of 60 hours per month by using SQL to automate manual processes.
3. Dashboarding tools
Effective communication through data visualisations is typically a vital part of data processing. And using dashboarding tools to produce visualisations is the perfect way to connect with both technical and non-technical stakeholders across your organisation.
Microsoft Power BI and Tableau are leading tools in the realm of data visualisation, each offering unique strengths.
Power BI integrates seamlessly with the Microsoft ecosystem, including Excel and Azure, providing intuitive dashboards and reports that leverage existing Microsoft data sources. It excels in user-friendliness and is suitable for those needing basic to moderately complex visualisations.
In contrast, Tableau focuses on more advanced visual analytics and customisation, creating highly interactive and visually compelling presentations.
“The course itself has given me a better understanding of the tools and techniques available, and this led to me using Tableau, where I was able to load a dataset with all of my required information and then produce visualisations once I added the required filters." - Imran Ayad, Data Analyst, Visa
Both tools streamline data processing by enabling users to derive insights swiftly and make informed decisions efficiently, even those with no data analysis experience.
RECOMMENDED READING: 5 Crucial Data and AI Skills That Will Advance Your Career

4. Natural language processing (NLP)
Natural language processing (NLP) is a branch of artificial intelligence focused on enabling machines to understand, interpret, and generate human language.
NLP algorithms process and analyse large volumes of textual data, identifying key insights and patterns that would be challenging or time-consuming for humans to uncover manually.
By automating these tasks, NLP significantly reduces data processing time, enabling organisations to handle vast amounts of text data and use the insights effectively.
NLP achieves this efficiency through various techniques, including machine learning models like neural networks, deep learning, statistical methods, and rule-based algorithms.
In business and research, NLP is increasingly used to sift through customer feedback, analyse social media trends, and automate content moderation.
Louise Baird, Lead People Analytics Manager at Marks & Spencer, applied her expertise in Natural Language Processing (NLP) to process a routine employee engagement survey.
Typically, such surveys sent to Marks & Spencer’s 60,000 employees would require manual reading for analysis. By using NLP, Louise automated this process, reducing the time required for analysis by 60%.
.webp?width=1050&height=591&name=158%20(1).webp)
Conclusion
Leveraging advanced tools like Python, SQL, Microsoft Power BI, Tableau, and Natural Language Processing (NLP) can revolutionise data processing efficiency. These technologies automate complex tasks, drastically reducing processing times and empowering organisations to quickly derive actionable insights.
If you have any questions about our data and AI courses, please don’t hesitate to get in touch via the form below. Or check out our blog “How to Balance Your Organisation’s Budget and Data Skills Shortage” to learn more about our courses and the right upskilling routes for your organisation.
-1.png)
Enquire now
Fill out the following form and we’ll contact you within one business day to discuss and answer any questions you have about the programme. We look forward to speaking with you.
